‧
7 min read
From spreadsheets to business intelligence
The Metabase Team
‧ 7 min read
Share this article
If you’re used to working exclusively in the world of Excel, Google Sheets, or Libreoffice Calc, you may wonder what the point of a business intelligence platform is.
Spreadsheets are everywhere for a reason — they’re familiar and efficient — and serve a purpose even in the most cutting-edge data environments. Data analysts with every BI tool at their disposal will still usually use Excel on a regular basis. Still, adopting a BI platform can be a huge benefit in the long run. Your data needs are likely to grow alongside your organization, and the features that a BI tool can help your organization level up.
What spreadsheets do well
It’s important not to immediately jump ship every time a shiny new tool arises. BI platforms offer some pretty cool features and can be quite useful, but if your organization’s data needs are satisfied by a spreadsheet application like Excel or Google Sheets, it’s okay if you don’t want to mess that up.
Spreadsheets are a powerful tool, and everyone knows how a table works, right? If your organization is on the smaller side, doesn’t have huge volumes of data to process, and is happy processing that data manually, stick with spreadsheets. Convincing your team to adopt a new platform with features they won’t even find useful will just be an exercise in frustration.
Spreadsheet applications are great for when you want to run a quick formula on the fly or change the values of one cell to see how the rest of your data might shift accordingly. Projections and what-if analyses can be run quite elegantly in Excel, which is why you’ll probably want to keep it around for some uses even if you do bring a BI platform into the mix.
Limits of spreadsheets
For all they do well, spreadsheets have limits — some of which you’ve probably encountered. For starters, they struggle with handling large amounts of data. Spreadsheets can get cumbersome as you introduce introduce multiple data sources and as your data needs grow. The size of your workbook file can get unwieldy, sometimes to the point of being unusable.
While cloud-based synching has made collaborating on spreadsheets easier, Excel is still at its core a software meant for one person editing a spreadsheet at their computer. This is less of an issue than it used to be, but making sure data is kept updated can still fall to whoever has the most recent version of a workbook, leading to mistakes and confusion for all involved. Keeping that data up-to-date can itself be a hassle — lots of copying and pasting, manual edits, and room for error.
As your organization grows and the amount of data you’re handling grows along with it, you may start to feel that you’re hitting a ceiling with spreadsheets. If you’ve noticed any of these signs in your organization, it may be time to look into how a BI tool can help:
-
All data work falls to your analyst(s). If people in your organization can’t meaningfully interpret spreadsheet data themselves, regardless of their skill level, you’re missing out on a lot of valuable insight.
-
You’re tired of working with outdated information or manually generating reports. If you’re used to a screenshot of a spreadsheet being emailed out to the whole team every Monday morning, you know that by Thursday those same numbers may not be as useful.
-
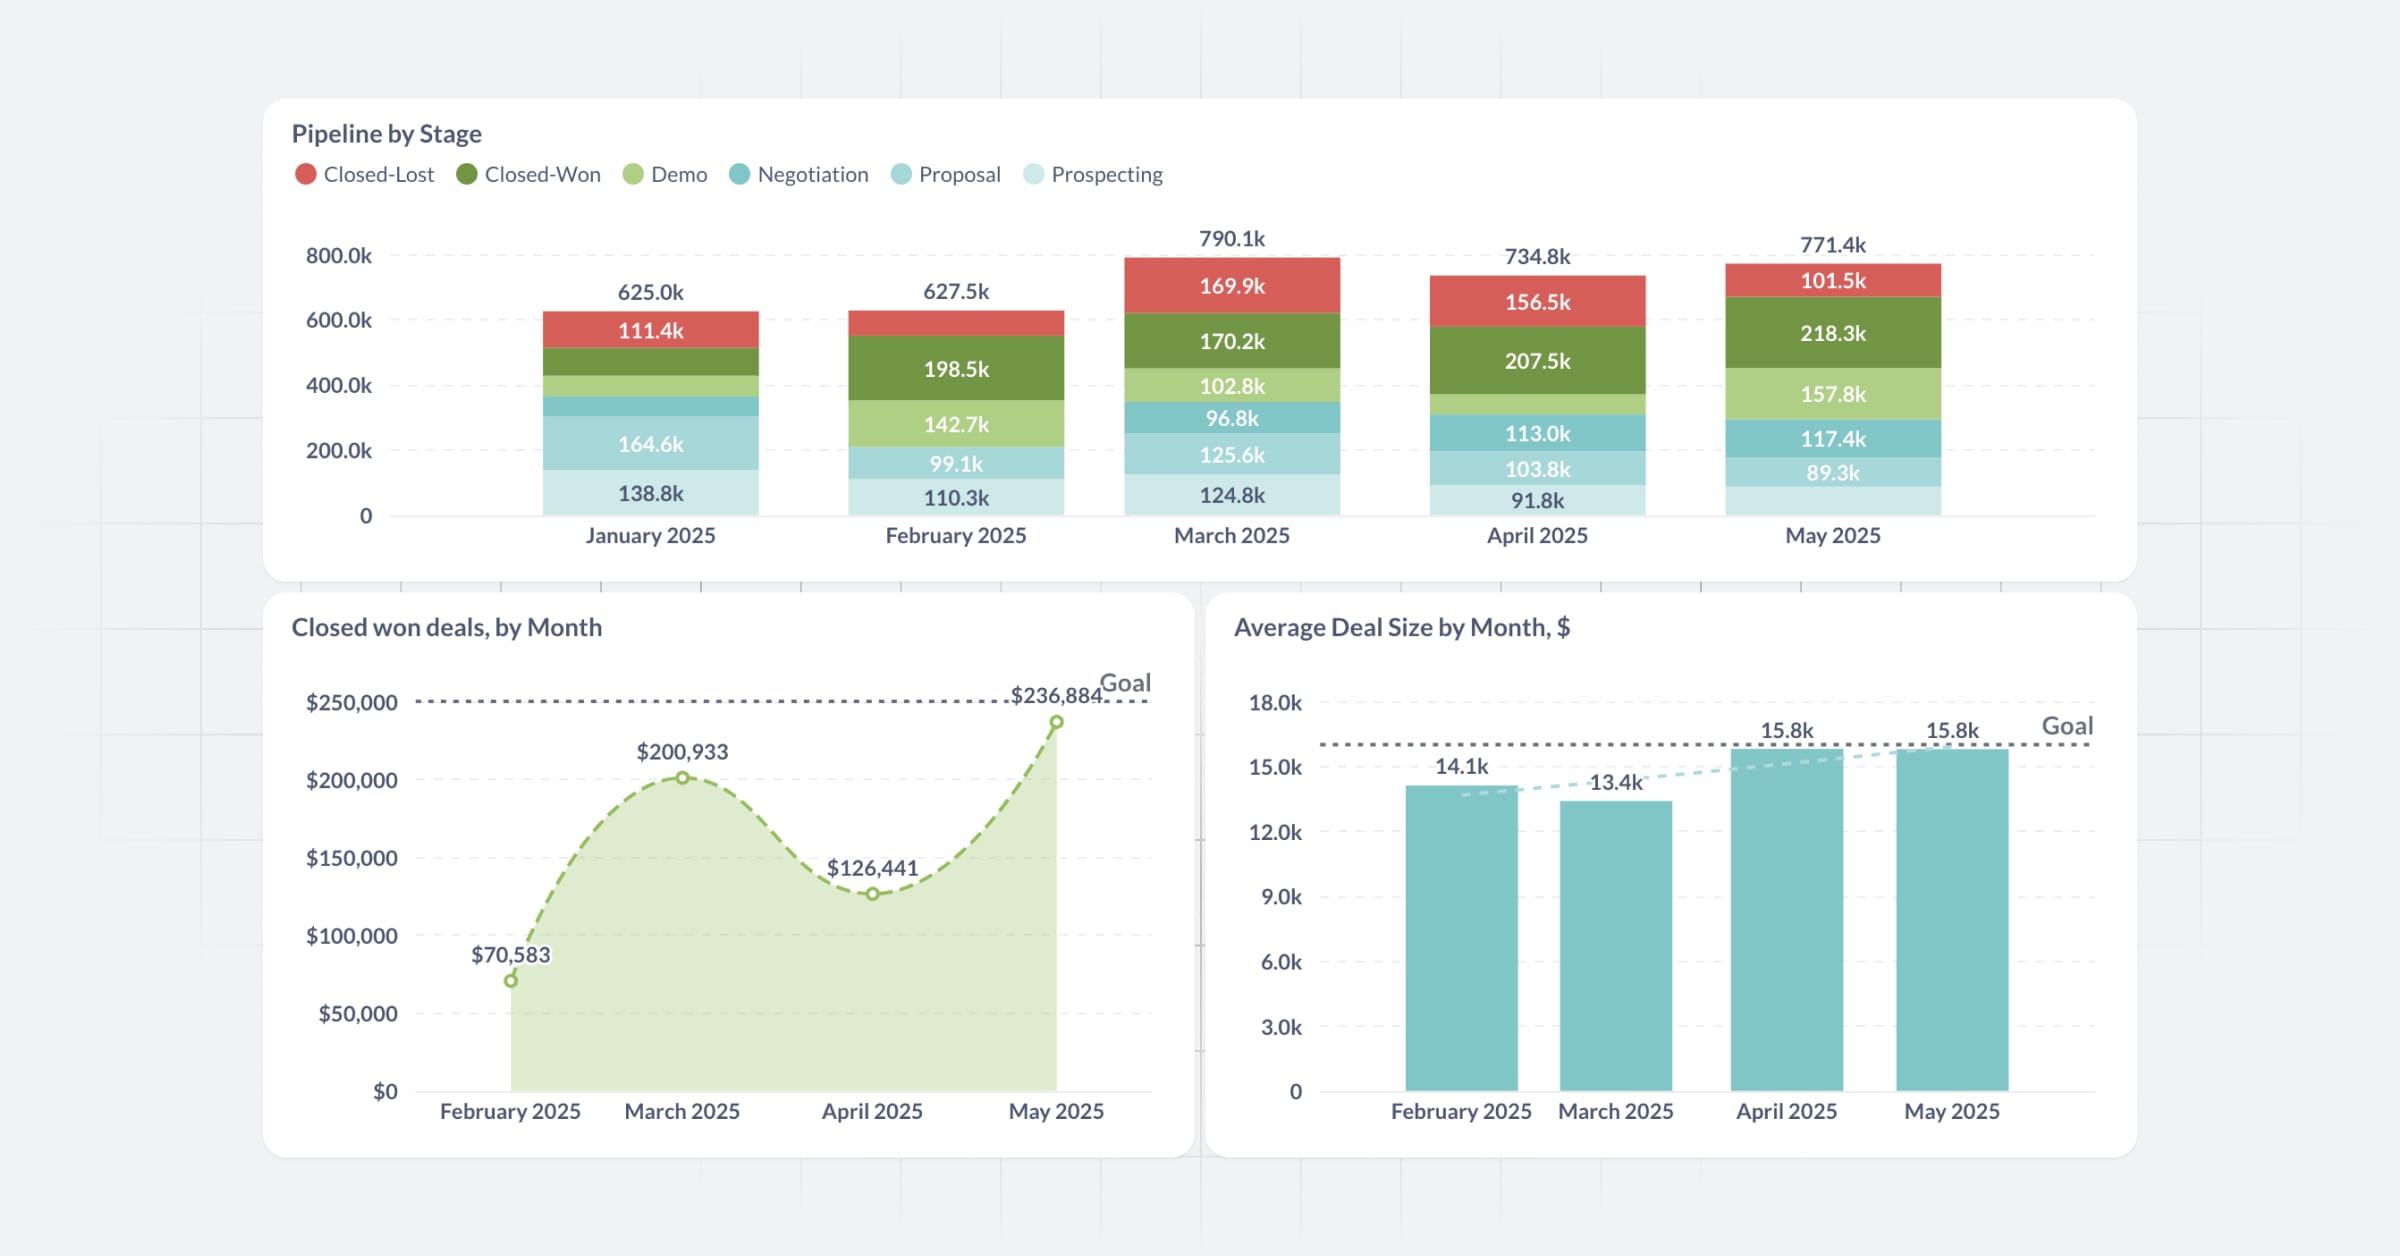
Complex formatting and static dashboards are slowing you down. With spreadsheet software, it’s easy to spend a lot of time formatting charts. Even if you’ve constructed elaborated dashboards in Excel, your colleagues can’t do much more than look at them. What if they want to know more about a specific field or view the data according to a different measure?
-
Some data isn’t for everyone, and password-protecting a spreadsheet isn’t cutting it. Depending on their department, people in your organization have access to different data, and you never want to be in the position of sending everyone a spreadsheet containing sensitive information.
What can a BI platform do that spreadsheets can’t?
Features of business intelligence platforms vary, but there are certain areas where BI tools will serve you better than exclusively using a spreadsheet application ever could.
Self-service analytics
Even though everyone at your organization knows how to read a table in a spreadsheet and can maybe even perform some basic functions, advanced spreadsheet proficiency is a rarified skill and not for everyone. Some BI tools are built to encourage everyone to take a crack at analyzing data and asking questions, regardless of their technical level or spreadsheet wizardry.
If you’re implementing a BI platform and want to encourage self-service analytics, a good place to start is by preparing your data model in a way that’s familiar to people in your organization. That is, present people with views of your data that look like spreadsheet tables. People are more likely to stick with using a BI tool if they know how to get the insights they need from it, and tabular views are a good place to start. From there, they can start exploring other features, like using your BI platform as a internal lookup tool or comparing data across time periods.
Reporting and standardization
If you’re used to sending out or receiving an email with a spreadsheet attached every Monday morning that contains the past week’s figures, it may be time to introduce a BI tool that can make sure you’re always accessing and reporting on the most recent information available.
Excel functions are typically executed manually, which can slow things down and introduce plenty of opportunity for mistakes. In addition to always pulling from the most up-to-date data sources, BI tools allow you to schedule and automate tasks like generating regular reports or sending alerts at specific intervals. You can create custom questions and interactive dashboards that your team can all access at once, meaning no one ever has to worry that they’re working on a different version than someone else. And if those dashboards and questions are useful, you can save them to reference again next week. This level of workflow standardization can help your team work more efficiently and gain insight into the data you have.
Flexible and interactive visualizations
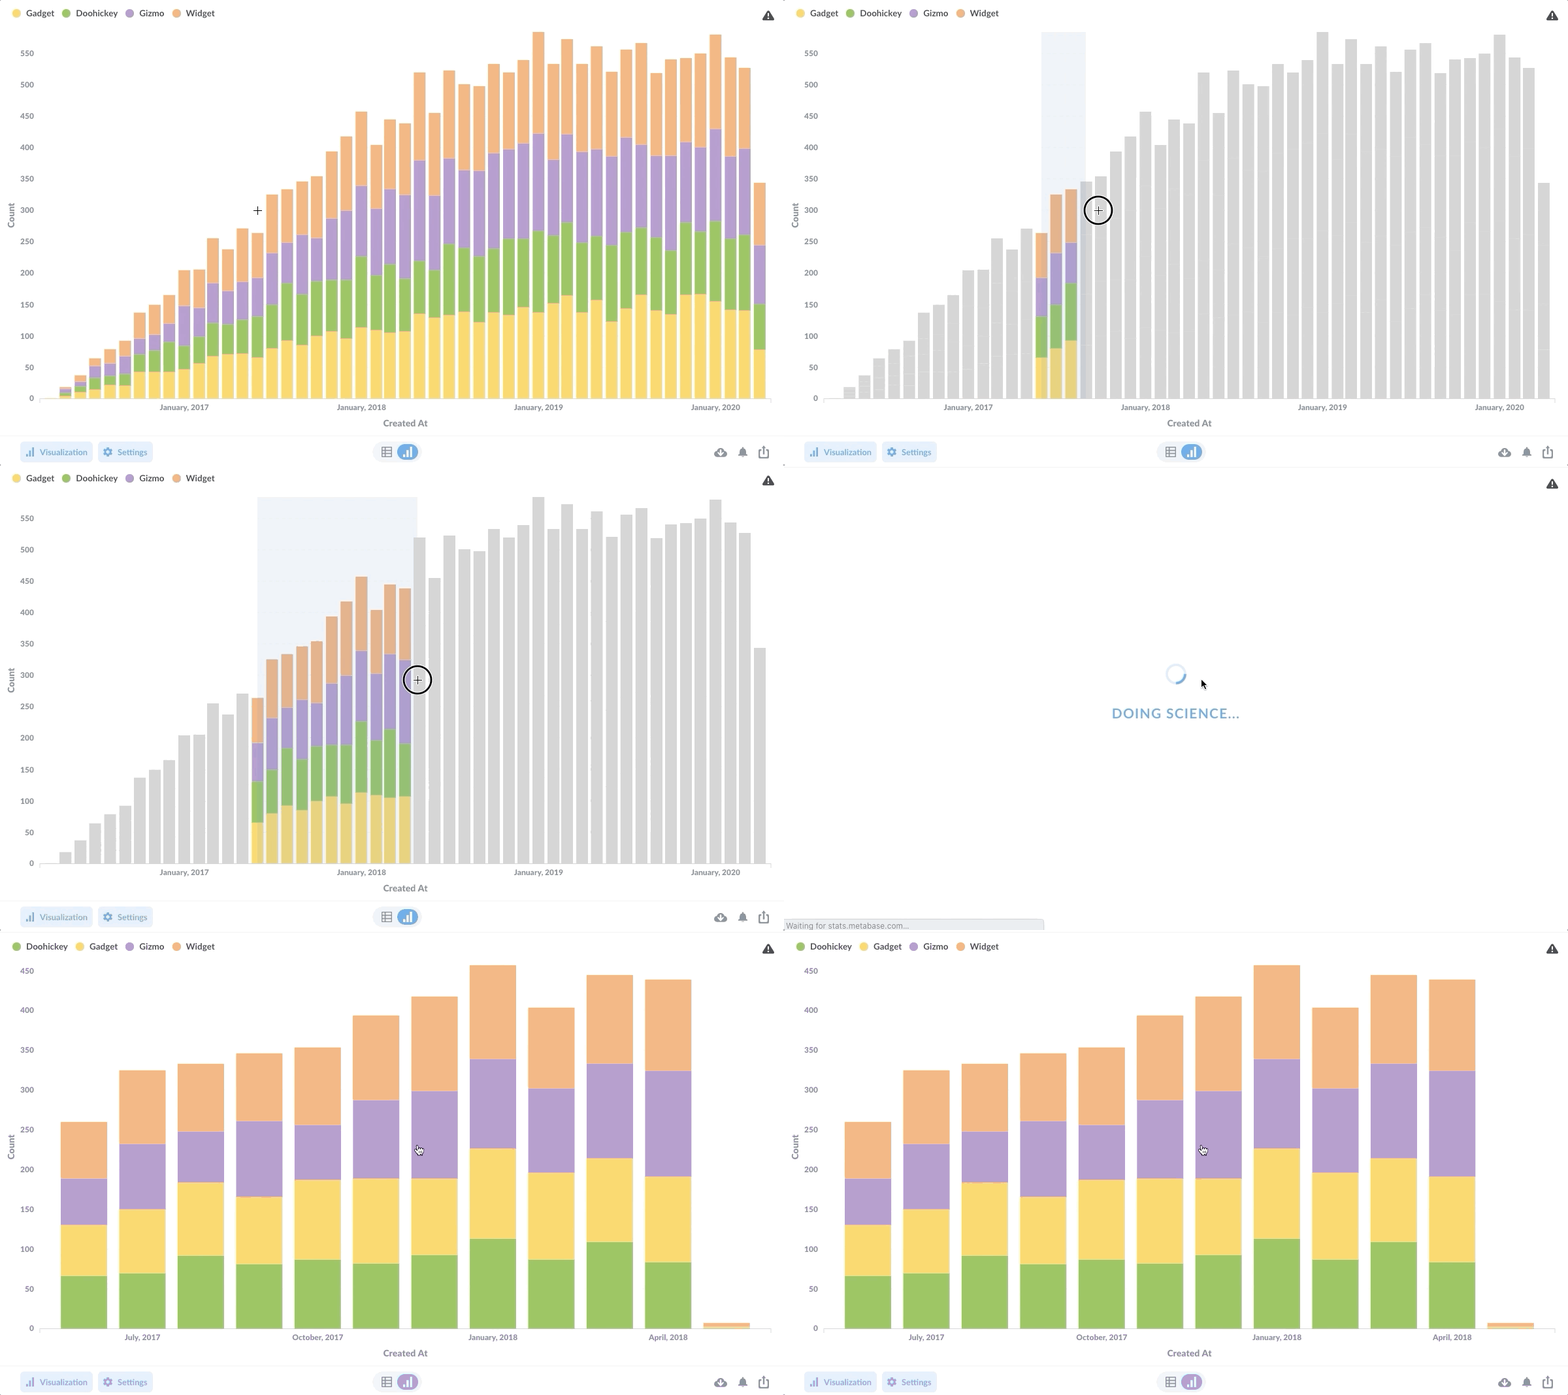
Sure, you can generate charts in Excel, but visualizations produced via a BI platform are usually far more dynamic and require less user formatting. One benefit to a BI tool like Metabase is that it’ll anticipate which charts will best suit the data you have. If your fields are location-based, like latitude and longitude, Metabase knows to generate a geographic map reflecting that. Once you have those charts, BI tools let you and your team interact with them in different ways, so you can do things like drill through on a chart to learn more about a specific range or value.

Get secure with permissions
The ability to grant specific permissions to different databases and tables is a big draw for many organizations who add a BI platform to their data analytics workflow. While you can always password-protect an Excel sheet, that’s far from foolproof security. If you need to secure certain tables from view, only grant write access to specific departments within your organization, or limit what questions people can ask of your data, a BI tool is the way to go.


